A panel on mathematical illustration, artificial intelligence, and how their roles intersect, diverge, and inform each other.
The Illustrating Math Virtual Seminar meets the second Friday of each month. Talks cover a wide range of topics related to successes and challenges of mathematical illustration, from cutting edge theoretical research to explorations of intersections between mathematics and the arts. The seminar showcases innovative ways to communicate and explore deep mathematical ideas.
The monthly seminar is held on Zoom. Each meeting opens with two five-minute ‘show and ask’ style presentations (volunteer here to give one), which are followed by the main feature, a 40 minute invited colloquium talk. Immediately afterwards, participants (and speakers) are invited to gather informally on the illustrating math discord server for further social interaction.
A panel on mathematical illustration, artificial intelligence, and how their roles intersect, diverge, and inform each other.
Understanding something means learning how it degenerates. In this talk, we explore how computational experiments and interactive applets illuminate interplays between topology, algebraic geometry, and arithmetic. We will tour several distinct but related phenomena: a braided Gauss-Lucas theorem, degeneracies of the 27 lines on real cubic surfaces, and techniques for identifying special points on varieties. Throughout, we emphasize how the process of illustration functions as a generative methodology, exposing structural subtleties, sharpening conjectures, and framing classical problems in fresh terms.
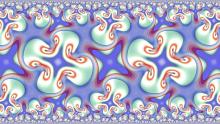
The geometry of continued fractions has been studied by numerous mathematicians, in particular through the Farey triangulation and the Ford circles. Recently in 2020, a deformation of continued fractions has been proposed by Morier-Genoud and Ovsienko in algebraic terms. In this talk, I shall present the geometry behind these deformations: the deformed Farey triangulation and a 1-dimensional circle fractal representing rational numbers. An extension to complex numbers leads to partial circle packings in 2d. Joint with Perrine Jouteur and Olga Paris-Romaskevich.
Illustration is a powerful and effective tool for exploring research questions in the theory of tiling — there’s no substitute for trying things out. We’ll show a few decades of our favorite drawings and give a live demo in Adobe Illustrator.
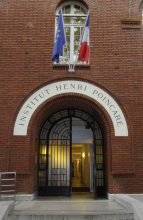
The Institut Henri Poincaré (in Paris) is currently hosting the trimester program "Illustration as a Mathematical Research Technique." This month, once again, the seminar will live stream from a modified "Show and Ask" session that will take place at IHP.
The Institut Henri Poincaré (in Paris) is currently hosting the trimester program "Illustration as a Mathematical Research Technique." This month, the seminar will live stream from a modified "Show and Ask" session that will take place at IHP.
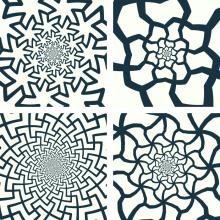
In the course of his explorations of the visual representation of infinity, M.C. Escher created several prints in which tessellated figures spiral inward towards a limit in the centre of the design. I present a pleasingly simple way to think about these spiral tilings, based on the exponential function in the complex plane, and connect it to a few other related ideas in mathematical art.
We present efficient computational methods for generating, visualizing, and interactively exploring symmetric patterns in Euclidean, spherical, hyperbolic, and inversive geometries. The algorithms are implemented in the open-source software package SymmHub, designed as a platform for experimentation and research in geometry.
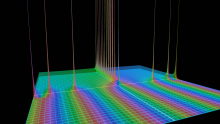
We’ll start from a very straightforward visual of the Riemann Zeta function as a sum, and proceed to alternate ways to interpret it so that we can make sense of it in the region of divergence. From there, we can play around with how it interplays with the sum over (1/k)(1/p^{ks}) on those same spots, where zeta zeros look like poles.
I give many outreach lectures to undergraduates explaining my research in knot theory and braid group representation theory. I will show the illustrating math community how I use Math-Dance videos in my outreach lectures.